Debugging
Debugging
When developing and refining your Flows, BotDojo provides powerful debugging tools to help you understand and optimize their behavior. One of the key features is the ability to inspect the execution of each node in your Flow.
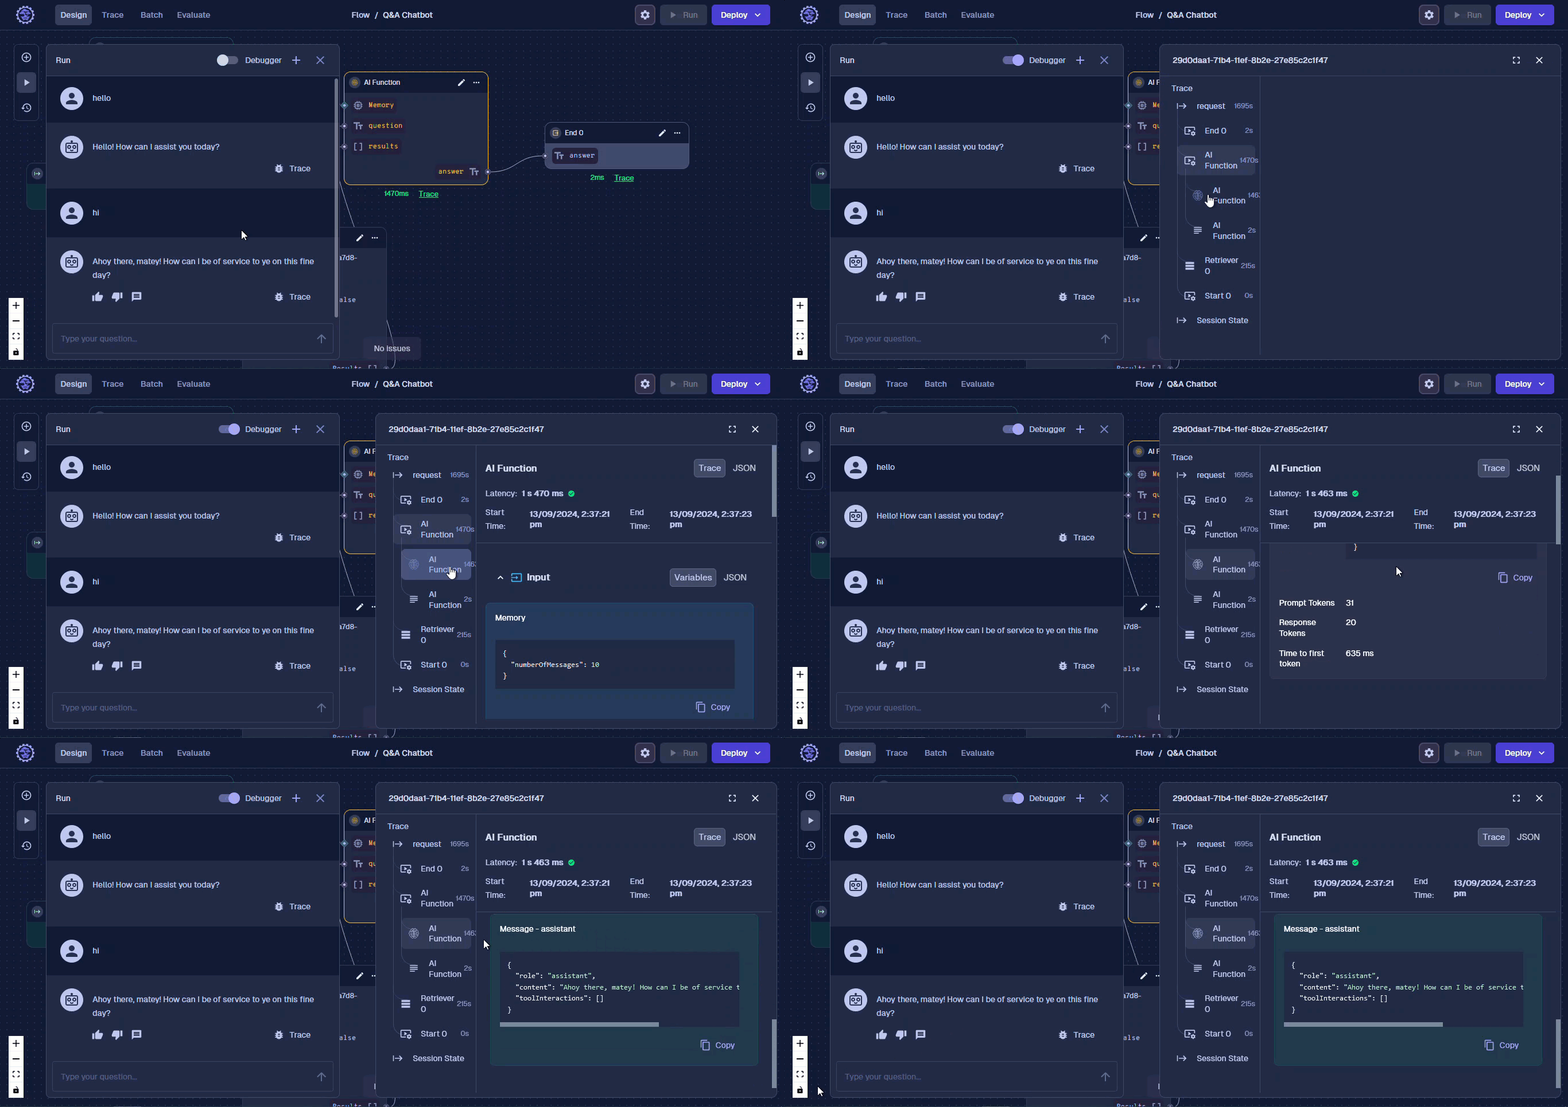
As your Flows process input and generate responses, you'll notice that the nodes will illuminate, indicating their active state. Once a node completes its task, you'll find two important pieces of information displayed beneath it:
-
Execution Time: This indicates how long the node took to process its task, providing valuable insights into performance bottlenecks.
-
View Trace: Clicking on this link opens up a detailed trace of the node's execution, giving you a deep dive into its internal workings.
The traces offer a comprehensive view of what happens inside each node, including the input it received, the processing steps it performed, and the output it generated. This level of visibility is crucial for understanding and debugging your Flow's behavior.
In addition to viewing individual node traces, BotDojo also provides a centralized Debug Panel. You can access this panel by clicking on the "Open the Debug Panel" button. The Debug Panel aggregates traces from all nodes, presenting a unified view of your Flow's execution.

With the Debug Panel, you can easily navigate through the entire flow, inspecting the inputs and outputs at each step. This is particularly useful when you need to track down issues that span multiple nodes or when you want to get a high-level overview of your Flow's conversational flow.